Ateliers R Trucs et Astuces
Introduction à R et représentation graphiques sous ggplot2
1/4/24
Utilisation générale
Le langage R en (très) bref
- Boucles

Utilisation générale
Le langage R en (très) bref
- Fonctions
Code
# Générer des données simulées
fonction_data <- function(n1, n2, m1, m2, s1, s2) {
  # n1: taille d'échantillon contôle
  # n2: taille d'échantillon traité
  # m1: moyenne échantillon contôle
  # m2: moyenne échantillon traité
  # s1: écart type échantillon contôle
  # s2: écart type échantillon traité

  ctrl <- rnorm(n1, m1, s1) # Simuler échantillon contôle
  trt <- rnorm(n2, m2, s2) # Simuler échantillon traité
  df <- data.frame(Trt = c(rep("Ctrl", n1),
                           rep("Trt", n2)),
                   Activity = c(ctrl, trt)) # Stocker les données
  return(df)
}
dsim <- fonction_data(50, 50, 50, 30, 5, 3) # Appeler la fonction
hist(dsim$Activity) # Visualiser
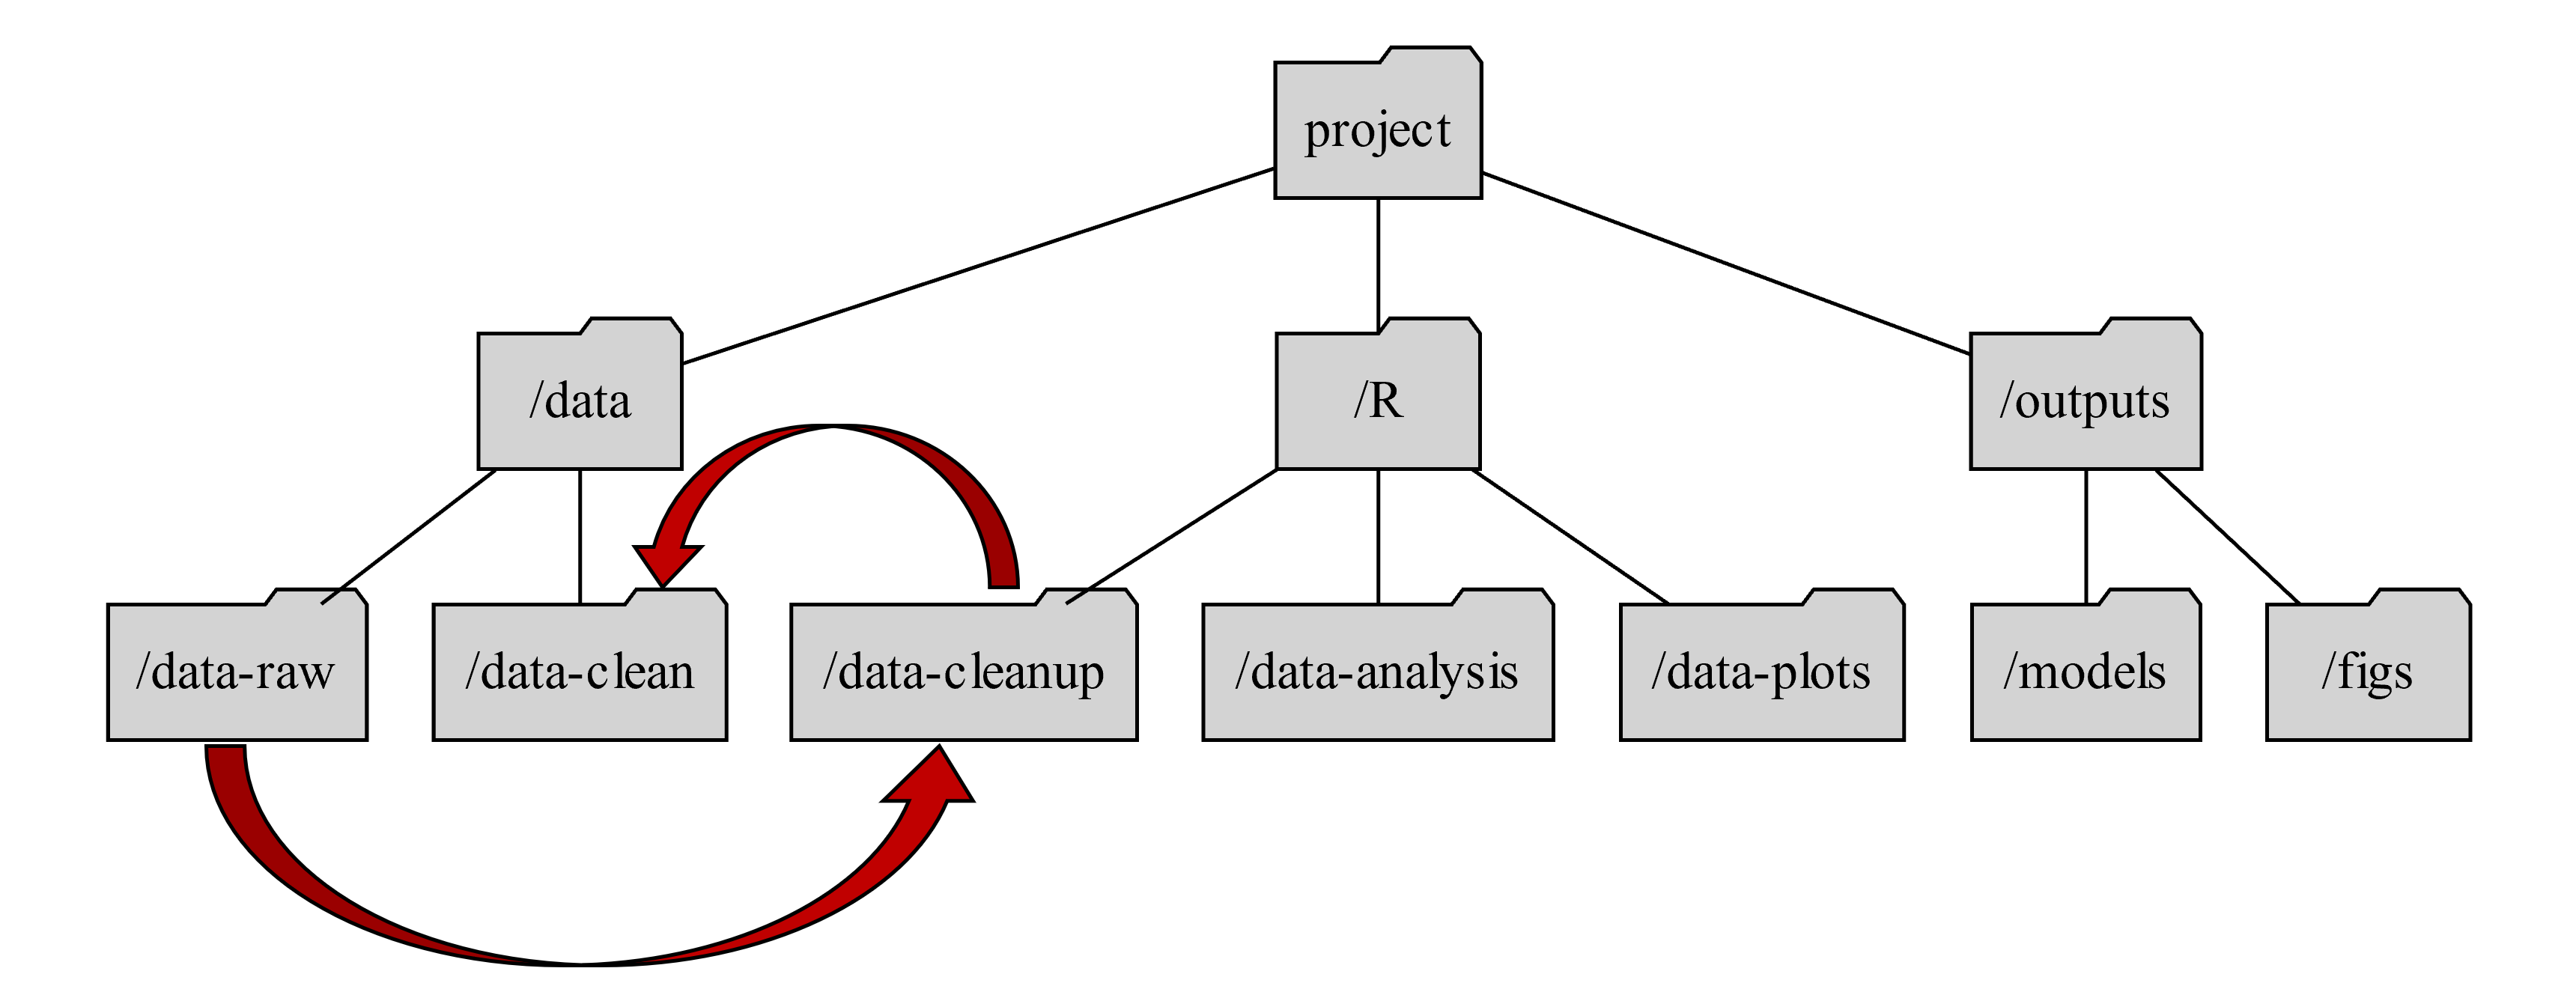
Créer son projet
- File -> New Project
- Outil de gestion de projet très puissant et intuitif
- Permet organisation des fichiers, scripts et sorties
- Chemins d’accès relatifs
Graphiques avec ggplot2 et palmerpenguins


Anatomie d’un ggplot
Graphique simple

Anatomie d’un ggplot
Customisation

Exercice 2 : Graphique complexe
Solution

Resources
Tutoriels - Data Science avec R - R Cookbook - Quick-R
Galleries - R Graphics Gallery
Livres - The R Book - Statistical Rethinking
Cours - Lectures Statistical Rethinking - eLearning INRAE
Débuggage - Stack Overflow - R-help